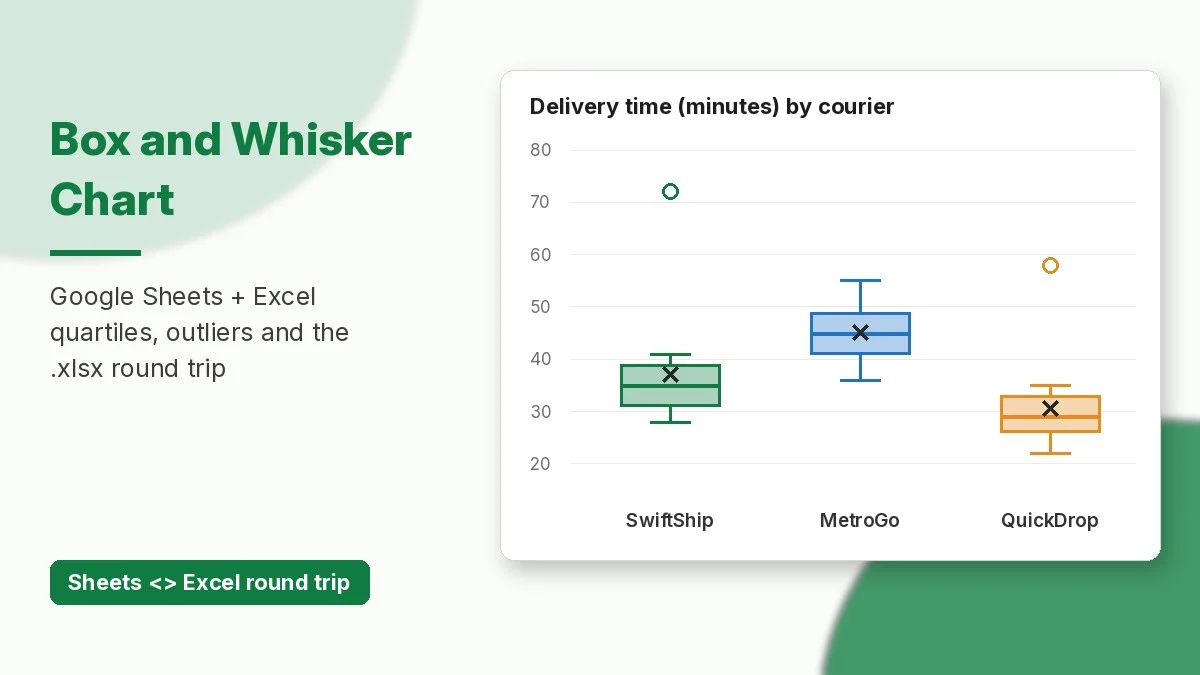
Google Sheets now has a native box and whisker chart. Google announced it on October 22, 2026. You select raw numbers and Sheets works out the minimum, quartiles, median, maximum, mean and outliers for you. Excel files that contain box and whisker charts now keep them when you open them in Sheets, and charts you build in Sheets export back to Excel as editable box and whisker charts.
This tutorial uses one small dataset, delivery times for three courier partners, to build the chart in Google Sheets and in Excel. It also explains inclusive and exclusive quartiles, checks the chart with formulas, and covers the Excel round trip. The free practice workbook at the end has the same data.
What a Box and Whisker Chart Shows
A box plot sums up a whole column of numbers in one shape. Google’s Sheets help page describes it like this:
- Box: runs from the first quartile (Q1, 25th percentile) to the third quartile (Q3, 75th percentile). Its height is the interquartile range (IQR).
- Median line: the middle value (50th percentile).
- Whiskers: reach the lowest and highest values that are within 1.5 × IQR of the box.
- Outliers: points plotted beyond the whiskers.
- Mean marker (optional): an X or dot for the average.
Use it when you want to compare how spread out several groups are. A column chart of averages would hide that spread. If you only need to see how values fall into buckets, see our histogram tutorial.
Sample Data: Courier Delivery Times
Put each group in its own column with a header. Every column becomes one box. Here are 15 delivery times in minutes for each courier, in A1:C16:
| SwiftShip | MetroGo | QuickDrop |
|---|---|---|
| 32, 35, 28, 41, 38 | 45, 38, 52, 41, 47 | 25, 30, 27, 34, 22 |
| 30, 36, 33, 39, 34 | 50, 36, 44, 49, 43 | 29, 31, 26, 33, 28 |
| 37, 31, 29, 40, 72 | 55, 40, 46, 42, 48 | 24, 35, 30, 27, 58 |
The table puts five values in each cell to save space. In the sheet, each value has its own row (rows 2 to 16). Two orders are clearly unusual: one SwiftShip delivery took 72 minutes and one QuickDrop delivery took 58.
How to Create a Box and Whisker Chart in Google Sheets
- Select A1:C16, including the header row so each box gets a label.
- Go to Insert > Chart.
- In the Chart editor, open Setup. Under Chart type, scroll to Statistical and choose Box and whisker chart.
- Open Customize > Series to turn outlier points, the mean marker and the mean line on or off, and to choose the Quartile calculation (inclusive or exclusive median).
- Under Chart & axis titles, add a title such as “Delivery time (minutes) by courier”.
You do not need helper columns. If your data already has the summary numbers (min, Q1, median and so on), Google suggests a candlestick chart instead.
Rollout: the feature started reaching Rapid Release domains on October 22, 2026, and Scheduled Release domains on November 6, 2026. Each rollout can take up to 15 days. It is available to all Google Workspace customers and to personal Google accounts, and there is no admin setting. If you do not see it under Statistical yet, check again in a few days.
How to Create the Same Chart in Excel
Excel has had this chart since Excel 2016. Microsoft’s support page lists Excel for Microsoft 365, 2024, 2021, 2019 and 2016 on Windows and Mac, plus Excel for iPad and iPhone.
- Select A1:C16.
- Go to Insert > Insert Statistic Chart > Box and Whisker.
- Right-click a box and choose Format Data Series. Under Series Options, set Show inner points, Show outlier points, Show mean markers, Show mean line and Quartile Calculation.
Google Sheets vs Excel Options
| Option | Google Sheets | Excel |
|---|---|---|
| Where to find it | Insert > Chart > Setup > Statistical | Insert > Insert Statistic Chart |
| Quartile method | Inclusive or exclusive median | Inclusive or exclusive median |
| Outliers / mean marker / mean line | Show or hide | Show or hide |
| Inner points | Show or hide | Show or hide |
| Who gets it | All Workspace and personal accounts (rolling out from Oct 22, 2026) | Excel 2016 and later, Microsoft 365 |
Inclusive vs Exclusive Quartiles
Both apps let you choose a quartile method. Microsoft’s help explains the difference: when the count of values is odd, the inclusive method counts the median in both halves of the data, and the exclusive method leaves it out. With 15 values per courier, the choice changes where the box edges fall:
| Courier | Median | Q1 / Q3 inclusive | Q1 / Q3 exclusive | Mean |
|---|---|---|---|---|
| SwiftShip | 35 | 31.5 / 38.5 | 31 / 39 | 37.0 |
| MetroGo | 45 | 41.5 / 48.5 | 41 / 49 | 45.1 |
| QuickDrop | 29 | 26.5 / 32 | 26 / 33 | 30.6 |
Pick one method, use it on every chart in a report, and say which one you used. When the data is large, the two methods give almost the same box.
Check the Chart With Formulas
These functions work the same way in Excel and Google Sheets. Use them to check the numbers behind each box (SwiftShip shown):
=MEDIAN(A2:A16)              → 35
=QUARTILE.INC(A2:A16,1)      → 31.5
=QUARTILE.EXC(A2:A16,1)      → 31
=QUARTILE.EXC(A2:A16,3)      → 39
=AVERAGE(A2:A16)             → 37
IQR (exclusive) = 39 - 31    → 8
Upper fence = 39 + 1.5*8     → 51
=COUNTIF(A2:A16,">51")       → 1   (the 72-minute delivery)
Using the exclusive quartiles and the 1.5 × IQR rule, SwiftShip’s upper whisker stops at 41 and 72 is shown as an outlier. QuickDrop’s fences are 15.5 and 43.5, so its whisker stops at 35 and 58 is an outlier. MetroGo has no outliers, but its box sits about 10 to 15 minutes higher than the others. That is the kind of difference a box plot makes obvious.
The Excel Round Trip
Before this update, a box and whisker chart in an .xlsx file was dropped when you imported the file into Google Sheets. Google says these charts now import with their data references, calculations and formatting intact. Charts you create in Sheets export to Excel (File > Download > Microsoft Excel (.xlsx)) as editable box and whisker charts.
Tips for a Clean Round Trip
- Set the same quartile method on both sides. If someone changes it in one app, the box edges move.
- Keep raw values in plain columns with one header row, with no merged cells or totals inside the range.
- Open the chart once after converting and compare it with the MEDIAN and QUARTILE formulas above.
Sharing results as a live mini-app instead of a file? See how to publish a Google Sheets canvas as a standalone link.
Frequently Asked Questions
Why can’t I find the box and whisker chart in Google Sheets?
The rollout is gradual. Rapid Release domains started on October 22, 2026, and Scheduled Release domains on November 6, 2026, with up to 15 days for the chart to appear. Look under Chart type > Statistical.
Do I need to calculate quartiles first?
No. Select the raw values and the chart calculates everything. Use formulas only to check the results or to label them.
Will my Excel box plot survive opening in Sheets?
Yes, according to Google’s announcement. It keeps its data references, calculations and formatting, and it exports back to Excel as an editable chart.
Which quartile method should I use?
Use the method your course, team or earlier reports used, and keep it the same on every chart. The difference only matters when a group has an odd number of values, and it gets smaller as the dataset grows.
Download the practice workbook
The same data as this tutorial, with empty answer cells and a Solutions sheet.
