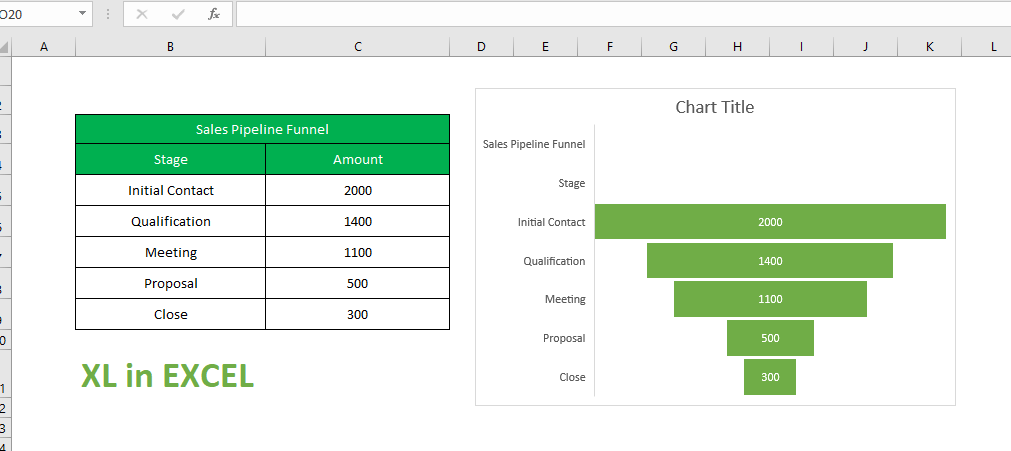
Funnel charts are a type of chart, often used to represent stages in a sales process and show the amount of potential revenue for each stage. This type of chart can also be useful in identifying potential problem areas in an organization’s sales processes. It is similar to a stacked
For example, you could use these charts to show the number of sales prospects at each stage in a sales pipeline. Typically, the values decrease gradually, allowing the bars to resemble a funnel
Note that unlike a real funnel, everything that is “poured in” at the top doesn’t flow through to the bottom. The name only refers to the shape of the chart, the purpose of which is illustrative.
Note: This feature is only available in Excel for Windows or Mac if you have Office 2019, or if you have an Office 365 subscription
Before the start, do have a look on “What’s new in Excel 2019 for Windows“
Table of Contents
Insert a Funnel Chart in Excel for Windows
Follow the steps below to insert the Chart in Excel for Windows
- Set up your data like the above example. Use one column for the stages in the process and one for the values.
- Select the data.
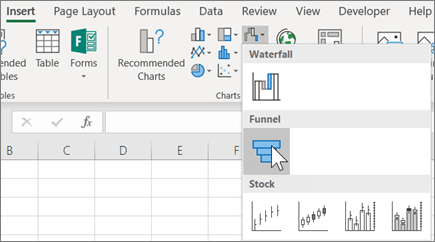
- Click Insert > Insert Waterfall, Funnel, Stock, Surface or Radar chart > Funnel
Tip: In Excel for windows, use the Design and Format tabs to customize the look of your chart. If you don't see these tabs, click anywhere in the chart, and then the Chart Tools will appear at the top of the program
Insert a Funnel Chart in Excel for MAC
Follow the steps below to insert the Chart in Excel for MAC
- Set up your data like the above example. Use one column for the stages in the process and one for the values.
- Select the data.
- On the ribbon, click the Insert tab, then click on the Waterfall chart icon and select Funnel.
Tip: In Excel for Mac, use the Chart Design and Format tabs to customize the look of your chart. If you don't see these tabs, click anywhere in the chart and the tabs will appear on the ribbon.
Insert a Funnel Chart in Excel for Android
Follow the steps below to insert the Chart in Excel for Android
- Set up your data like the above example. Use one column for the stages in the process, and one for the values.
- Select the data.
- Click Insert > Chart > Funnel.
Read Also: Useful Excel Keyboard Shortcuts and Function Keys for Windows
If you have any doubt, feel free to contact.