In Excel 2007, and later versions, you can use the Table command to convert a list of data into a formatted Excel Table. Tables have many features, such as sorting and filtering, that will help you to organize and view your data.
Before the start, do have a look on “What’s new in Excel 2019 for Windows“
Table of Contents
Preparing your Data before Creating a Table
Before you create the formatted Excel Table, follow these guidelines for organizing your data.
- The data should be organized in rows and columns, with each row containing information about one record, such as a sales order, or inventory transaction.
- In the first row of the list, each column should contain a short, descriptive and unique heading.
- Each column in the list should contain one type of data, such as dates, currency, or text.
- Each row in the list should contain the details for one record, such as a sales order. If possible, include a unique identifier for each row, such as an order number.
- The list should have no blank rows within it and no completely blank columns.’
- The list should be separated from any other data on the worksheet, with at least one blank row and one blank column between the list and the other data.
Copy the example data in each of the following tables, and paste it in cell A1 of a new Excel worksheet.
| Product | Qtr 1 | Qtr 2 | Total |
| Chocolate | 262 | 256 | 518 |
| Icecream | 515 | 1543 | 2058 |
| Bread | 515 | 416 | 931 |
| Eggs | 5151 | 521 | 5672 |
| Milk | 956 | 563 | 1519 |
| Rice | 258 | 587 | 845 |
| Biscuits | 654 | 652 | 1306 |
| Maggi | 256 | 854 | 1110 |
Create a Table in Microsoft Excel
After your data is organized, as described above, you’re ready to create the formatted Table.
1. Select a cell in the list of data that you prepared.
2. On the Ribbon, click the Insert tab.
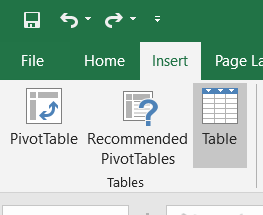
3. In the Tables group, click the Table command or Press CTRL + T
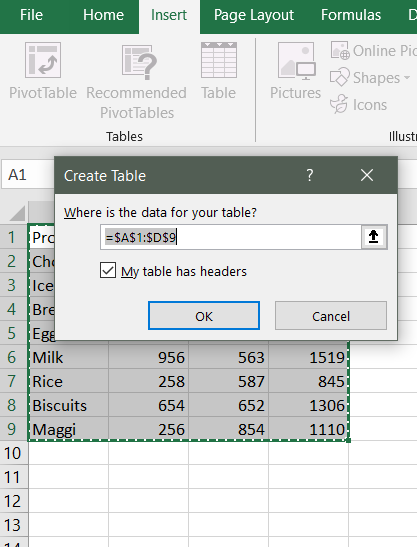
4. In the Create Table dialogue box, the range for your data should automatically appear, and the My table has headers option is checked. If necessary, you can adjust the range and checkbox.
5. Click OK to accept these settings.
Learn more about the elements of an Excel table
A table can include the following elements:
Header row
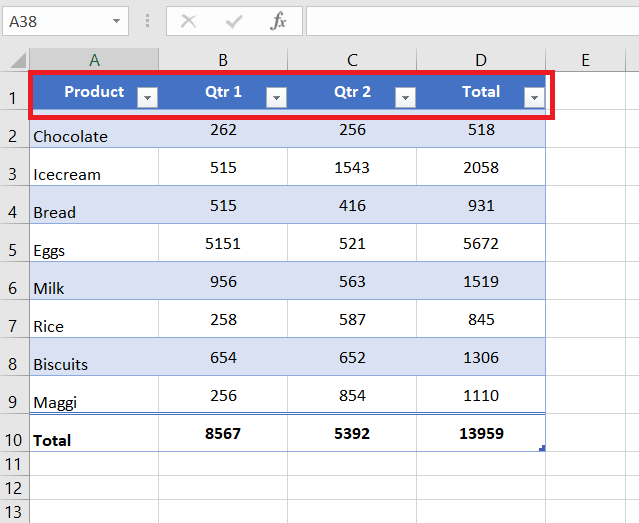
By default, a table has a header row. Every table column has filtering enabled in the header row so that you can filter or sort your table data quickly.
Banded rows
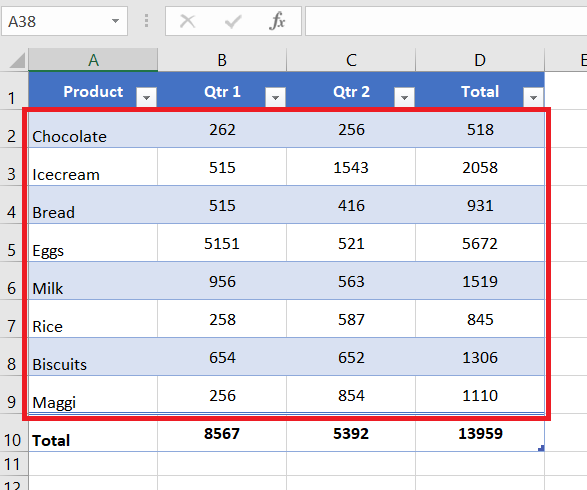
By default, alternate shading or banding has been applied to the rows in a table to better distinguish the data.
Calculated columns
By entering a formula in one cell in a table column, you can create a calculated column in which that formula is instantly applied to all other cells in that table column.
Total row
You can add a total row to your table that provides access to summary functions (such as the AVERAGE, COUNT, or SUM function). A drop-down list appears in each total row cell so that you can quickly calculate the totals that you want.
Sizing handle
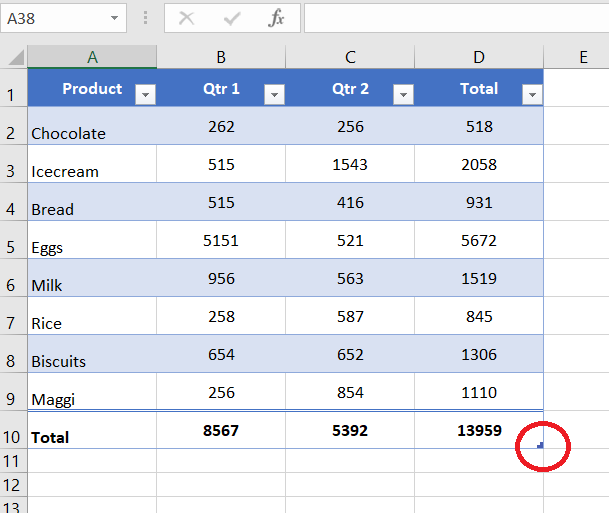
A sizing handle in the lower-right corner of the table allows you to drag the table to the size that you want.
Manage Table in Microsoft Excel
To make managing and analyzing a group of related data easier, you can turn a range of cells into a Microsoft Office Excel table (previously known as an Excel list). A table typically contains related data in a series of worksheet rows and columns that have been formatted as a table. By using the table features, you can then manage the data in the table rows and columns independently from the data in other rows and columns on the worksheet.
Managing data in an Excel table
You can use one table to manage your data, but if you want to manage several groups of data, you can insert more than one table in the same worksheet.
Note: If the workbook is a Shared Workbook, then tables cannot be created.
Table features that you can use to manage table data
Sorting and filtering
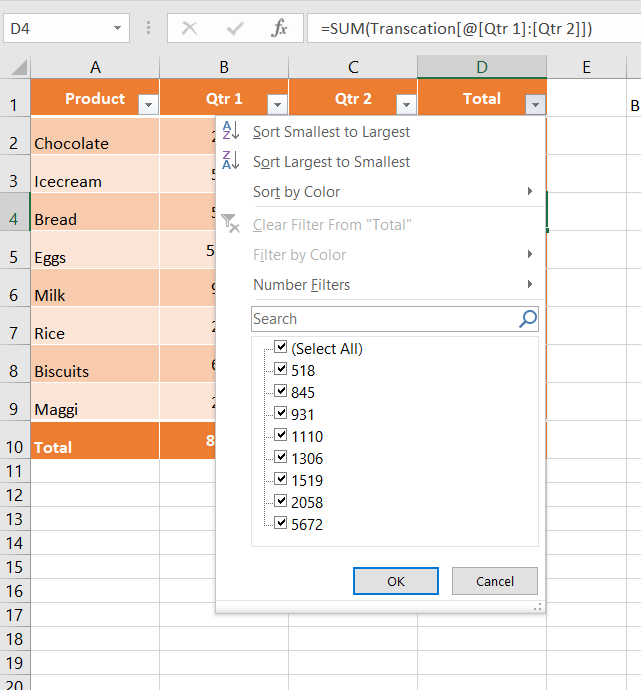
Filter drop-down lists are automatically added in the header row of a table. You can sort tables in ascending or descending order or by colour, or you can create a custom sort order. You can filter tables to show only the data that meets the criteria that you specify, or you can filter by colour.
Rename an Excel Table
When table is created, an Excel table is given a default name, such as Table 1 or Table 2 and so on. You should change the name to something meaningful, so it will be easier to work with the table later.
Read Also: Useful Excel Keyboard Shortcuts and Function Keys for Windows
To change the table name:
1. Select any cell in the table
2. On the Ribbon, under the Table Tools tab, click the Design tab.
3. At the far left of the Ribbon, click in the Table name box, to select the existing name
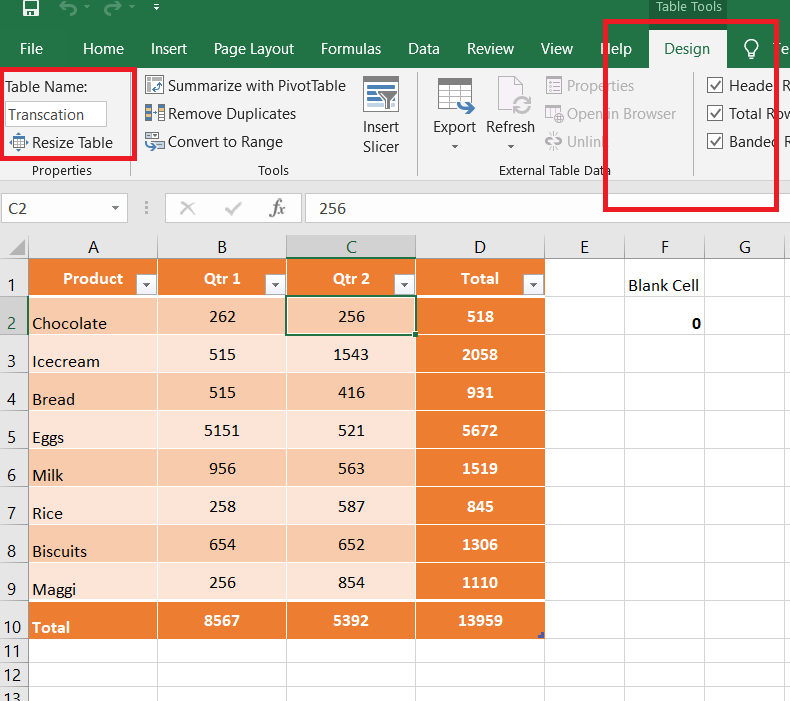
4. Then, type a new name, such as Transaction, and press the Enter key
Formatting table data
You can quickly format table data by applying a predefined or custom table style. You can also choose Table Styles options to display a table with or without a header or a totals row, to apply row or column banding to make a table easier to read or to distinguish between the first or last columns and other columns in the table.
Inserting and deleting table rows and columns
You can use one of several ways to add rows and columns to a table. You can quickly add a blank row at the end of the table, include adjacent worksheet rows or worksheet columns in the table, or insert table rows and table columns anywhere that you want. You can delete rows and columns as needed. You can also quickly remove rows that contain duplicate data from a table.
Using a calculated column
To use a single formula that adjusts for each row in a table, you can create a calculated column. A calculated column automatically expands to include additional rows so that the formula is immediately extended to those rows.
Displaying and calculating table data totals
You can quickly total the data in a table by displaying a totals row at the end of the table and then using the functions that are provided in drop-down lists for each totals row cell.
Using structured references
Instead of using cell references, such as A1 and R1C1, you can use structured references that reference table names in a formula.
Ensuring data integrity
For tables that are not linked to SharePoint lists, you can use the built-in data validation features in Excel. For example, you may choose to allow only numbers or dates in a column of a table.
Excel Table with Specific Style
When you create a table with the Table command on the Ribbon’s Insert tab, the table retains any formatting that it currently has, and the default Table Style is applied.
If you want to apply a specific table style when creating an Excel Table:
1. Select a cell in the list of data that you prepared.
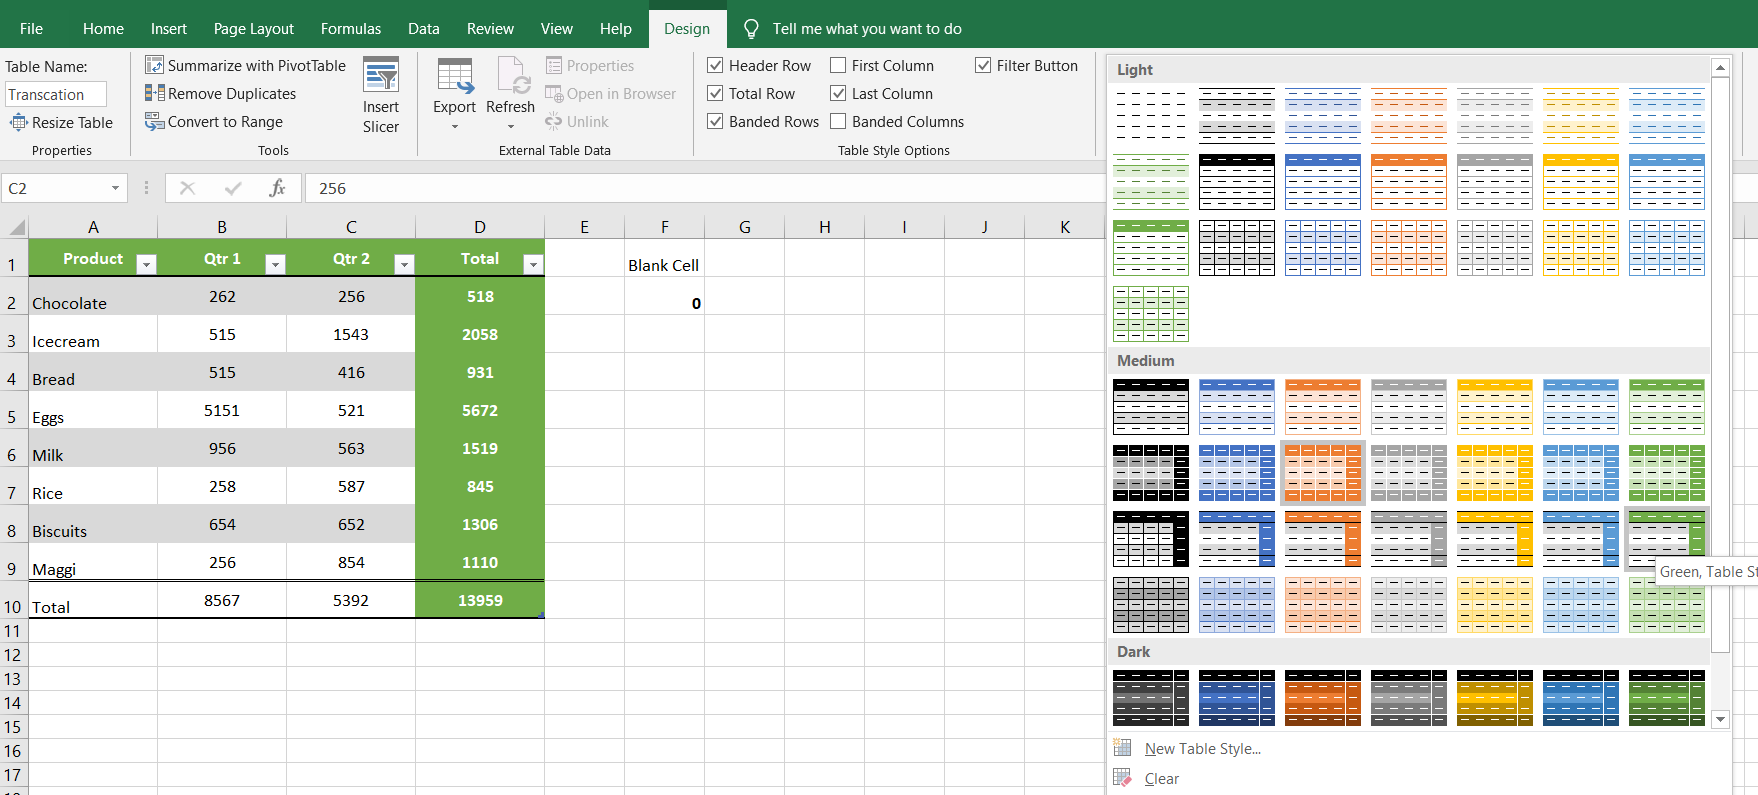
2. On the Ribbon, click the Home tab.
3. In the Styles group, click Format as Table
4. Click on the Style that you want to use
OR, to apply a Style and remove any existing formatting, right-click on a Style, and click Apply and Clear Formatting
5. In the Create Table dialog box, the range for your data should automatically appear, and the My table has headers option is checked. If necessary, you can adjust the range, and check box.
6. Click OK to accept these settings.
A formatted Excel Table is created, with the selected Table Style.
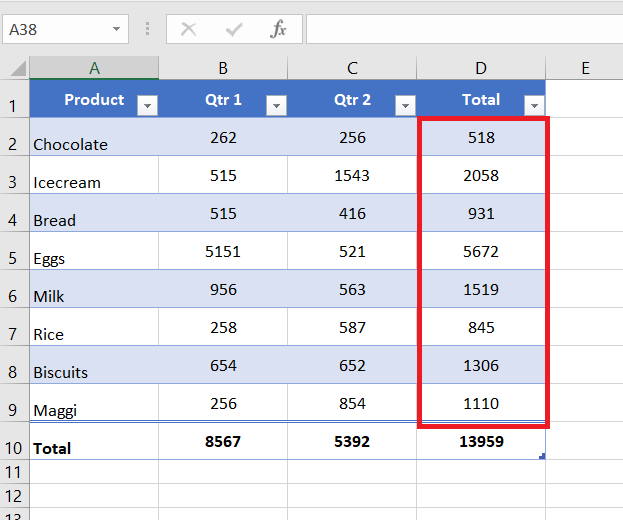
Show Totals in a Table
After you create an Excel table, it’s easy to show the total for a column, or for multiple columns, using a built-in Table feature.
To show a total:
1. Select any cell in the table
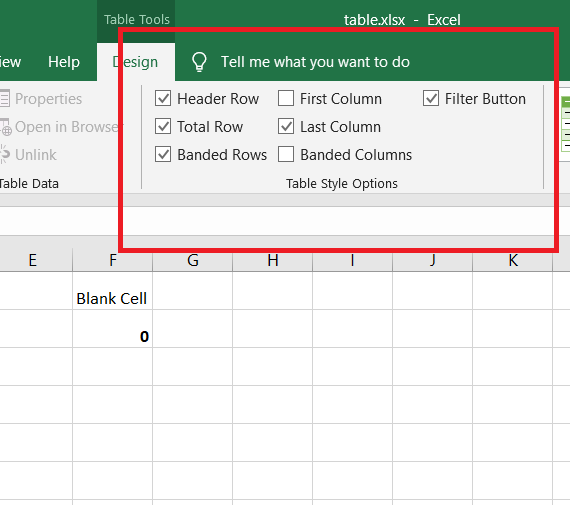
2. On the Ribbon, under the Table Tools tab, click the Design tab
3. In the Table Style Options group, add a check mark for Total Row
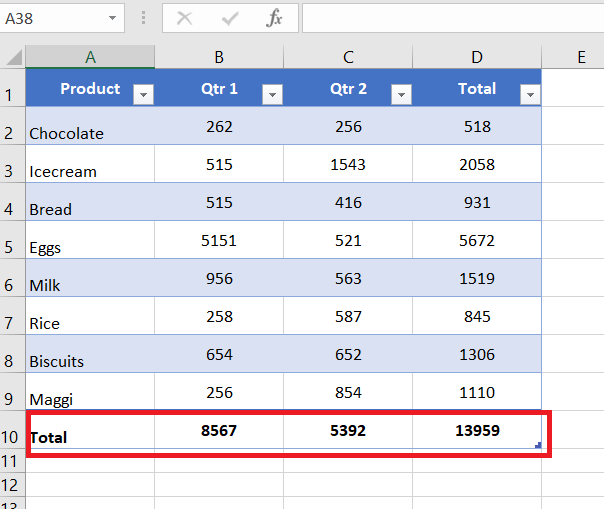
4. A Total row will be added at the bottom of the table, and one or more column of numbers might show a total.
Change and Add Totals
1. In addition to the automatically created totals, you can select totals for other columns.
2. From the drop down list, select the function that you want to use in the current column.
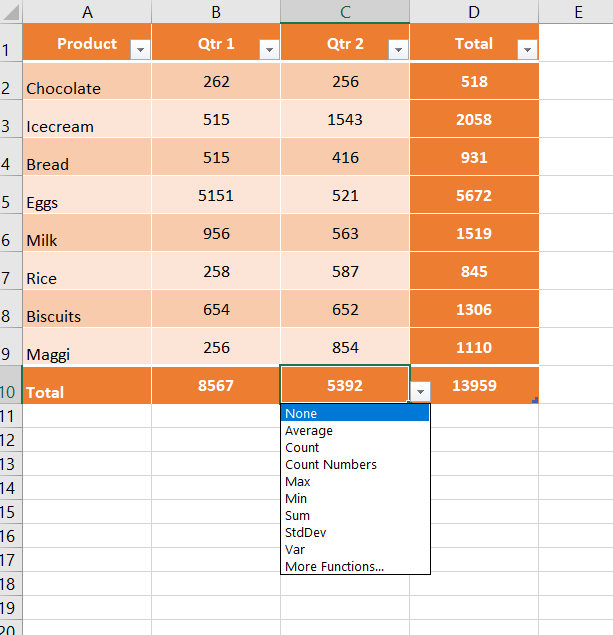
A SUBTOTAL formula is added to the cell, and it shows the calculation based on the visible cells in the table’s column.
Refer to Table Column in Formula
When a formula refers to part of a named Excel Table, a Structured Reference is created. The Structured Reference will show the table’s column name, and might include the table name. For example, this reference is to the Product column in a table named TransactionRef — TransactionRef[Product]
Formula Outside the Table
In this example, a formula will be created outside of the table. The formula will use the COUNTBLANK function to count the blank cells in a table column. The table is named OrderRef and the column is named Product.
1. To start the formula, select a blank cell and type: =COUNTBLANK(
2. Then, click at the very top of the heading cell, for the column that you want to check — the pointer will change to a down arrow.
Don’t click on the column button where the column letter is.
And don’t click in the middle of the heading cell
3. The structured reference should show the table name and the column name: =COUNTBLANK(Transcation[[Product]:[Qtr 2]])
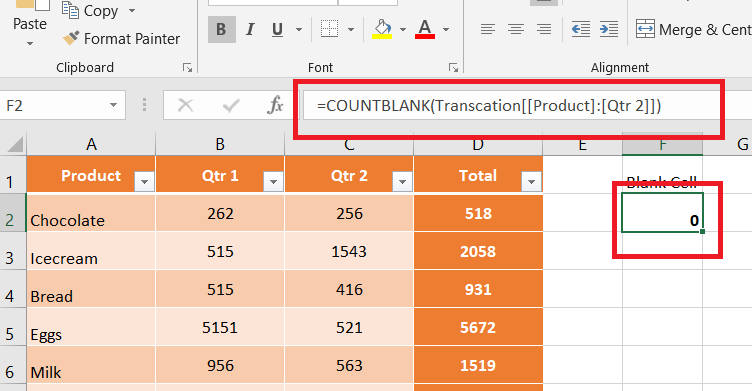
4. Then, type a closing bracket, and press Enter, to complete the formula.
Add a Counter Field
If you plan to use your Excel table as the source data for a pivot table, add a counter field, that can be used in calculated fields, or summary calculations.
This is very easy to create and maintain in an Excel table, if you use a simple formula, instead of typing the value.
1. On the OrdersTable sheet, add a new heading in first blank column — Sales
2. In the cell below the heading, type a formula: =1
3. Press Enter, to complete the formula
Because the data is in a named Excel table, the formula will automatically fill down to all the rows. It will also be automatically entered when you add new rows.
The 1s will give us a value that can be summed in a pivot table, or used in a Calculated Field, to give correct results.
Print Excel Table Only
When you are working with lists in Excel, use the built-in Table feature, to make it easier to work with the data. Then, if you want to print just the table, without the other items on the worksheet, you can use a built-in command — Print List.
The command is not on the Ribbon, so you can add it there, or put the command on the Quick Access Toolbar.
Table Doesn’t Expand For New Data
By default an Excel table will expand automatically, and fill formulas down to the last row. For example:
- Add new data in the row immediately below a table, or in the column to its immediate right, and the table expands automatically, to include that new data.
- Enter a formula in the first row of a blank column, that formula fills down to all the remaining rows, as soon as you press Enter
If Excel tables are not expanding automtically on your computer, you can adjust the settings either manually, or with VBA programming.
NOTE: Changing these settings will affect all workbooks that you open in Excel, on your computer.
Turn These Settings On Manually
If Excel tables are not expanding automtically on your computer, check the following settings, in the Excel Options window.
1. At the left end of the Ribbon, click the File tab, then click Options
2. In the Excel Options window, at the left, click Proofing
3. In the AutoCorect options section, click AutoCorrect Options
4. Click the AutoFormat As You Type tab
5. Add check marks to “Include new rows and columns in table” and “Fill formulas in tables to create calculated columns”
6. Click OK, twice, to return to Excel
Now, when you add new data, or create a calculated column, the Excel table should adjust automatically.
Turn These Settings On or Off With VBA
To turn these settings ON with VBA, use the following lines of code:
Sub ListAutoSetOn()
With Application.AutoCorrect
.AutoExpandListRange = True
.AutoFillFormulasInLists = True
End WithEnd Sub
To turn these settings OFF with VBA, use the following lines of code:
Sub ListAutoSetOff()
With Application.AutoCorrect
.AutoExpandListRange = False
.AutoFillFormulasInLists = False
End WithEnd Sub
List All Tables in Workbook
The following code will list all the named Excel Tables in the active workbook. A new worksheet is inserted, and the table name, sheet name, table address, and source type are listed.
Sub ListTables()
Dim ws As Worksheet
Dim Lst As ListObject
Dim wsL As Worksheet
Dim lCount As LonglCount = 1
Set wsL = Worksheets.Add
With wsL.Range(“A1:E1”)
.Value = Array(“ID”, “Table”, “Location”, “Sheet”, “Source Type”)
lCount = lCount + 1
End WithFor Each ws In ActiveWorkbook.Worksheets
If ws.ListObjects.Count > 0 Then
For Each Lst In ws.ListObjects
wsL.Cells(lCount, 1).Value = lCount
wsL.Cells(lCount, 2).Value = Lst.Name
wsL.Cells(lCount, 3).Value = Lst.Range.Address
wsL.Cells(lCount, 4).Value = ws.Name
wsL.Cells(lCount, 5).Value = Lst.SourceType
lCount = lCount + 1
Next Lst
End If
Next wsEnd Sub
Exporting to a SharePoint list
You can export a table to a SharePoint list so that other people can view, edit, and update the table data.
If you have access to an authoring permission on a Microsoft Windows SharePoint Services site, you can use it to share a table with other users. By exporting table data to a SharePoint list, other people can view, edit, and update the table data in the SharePoint list. You can create a one-way connection to the SharePoint list so that you can refresh the table data on the worksheet to incorporate changes that are made to the data in the SharePoint list. You can no longer update a SharePoint list with changes that you make to the table data in Excel. After exporting the table data to a SharePoint list, you can open a SharePoint list in Excel as read-only — any changes that you want to make can be made only to the data on the SharePoint site.
Read Also
If you have any doubt, feel free to contact.